


iReport: Eliminating Data Fraud Through Strategic UX Design
How I transformed a paper-based system plagued by falsified data into a trusted GPS-verified field reporting system for Philip Morris Algeria’s tobacco sales operation.
Client: Philip Morris International (Algeria Division)
Industry: Tobacco / FMCG (Fast-Moving Consumer Goods)
Platform: iPad App (Sales Field Force) + Web Dashboard (Top Management)
Timeline: Jan 2018 – 8 months (3-month MVP + 5-month iteration and dashboard build)
My Role: Solo UX/UI Designer
Team: Agency Developer (CEO), PMI Stakeholders
Users: 300+ field sales agents + Algeria’s national sales management team

I transformed Philip Morris Algeria’s paper-based field reporting system plagued by data falsification into a GPS-verified digital solution, reducing data fraud by 50% and increasing field agent engagement by 30% across 300+ sales representatives.
My Role at iReport
- Solo UX/UI Designer for mission-critical digital transformation at Philip Morris Algeria
- Led field research strategy with direct agent immersion and ride-alongs
- Designed dual-platform experience – iPad app for 300+ field agents + web dashboard for management
- Delivered under aggressive timeline – 3-month MVP + 5-month iteration cycle
- Collaborated with agency CEO/developer and PMI stakeholders on enterprise-scale solution
The Challenge
Philip Morris Algeria’s field sales agents were falsifying paper-based data collection, submitting reports from home instead of visiting retail locations. Management had zero visibility into actual field presence, creating a complete breakdown of trust and compliance risk in a heavily regulated tobacco industry.
Business Impact & Results
| Metric | Before | After | Improvement |
|---|---|---|---|
| Data falsification | High rates | GPS-verified | 50% reduction |
| Data collection time | 20 minutes | 5 minutes | 75% faster |
| Field engagement | Low | Improved | 30% increase |
| Photo compliance | Inconsistent | Mandatory | 100% compliance |
| Compliance risk | Weeks delay | Real-time | 70% faster |
| Support requests | High volume | Reduced | 50% reduction |
| Agent adoption | Resistant | Adopted | 90% in 6 weeks |

User Research & Field Insights
Research Method: Direct field immersion with 6 sales agents across Algeria, observing real store visits and data collection challenges.
Critical Discoveries
- Environmental constraints: Agents working outdoors in bright sunlight, often one-handed while driving
- Trust breakdown: Management had zero confidence in submitted data accuracy
- Cognitive overload: Complex 20+ field paper forms overwhelming users under time pressure
- Process inefficiency: Manual transcription creating delays and additional errors
Key User Insight: The problem wasn’t poor tools – it was complete breakdown of trust between field agents and management requiring behavioral design intervention.
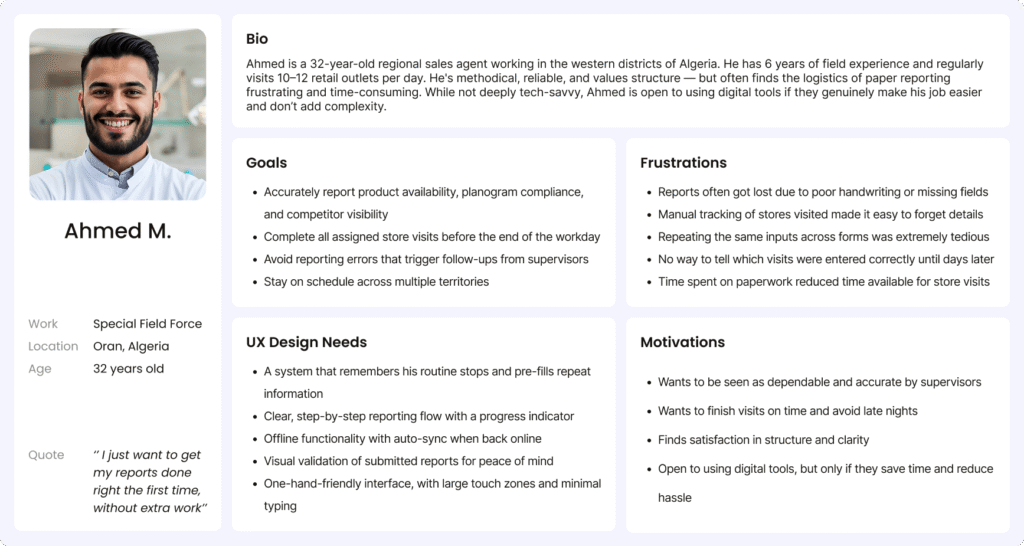
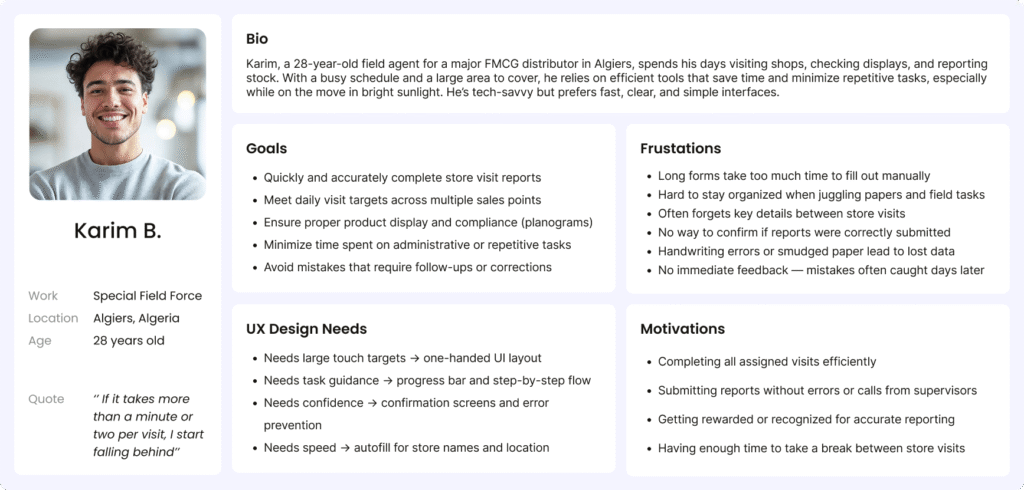
User Personas
Based on my field research and early conversations with the Sales Field Force team, I created two representative personas to guide design decisions and ensure the tool would meet the needs of real agents on the ground.
Persona 1: Ahmed M.
Persona 2: Karim B.
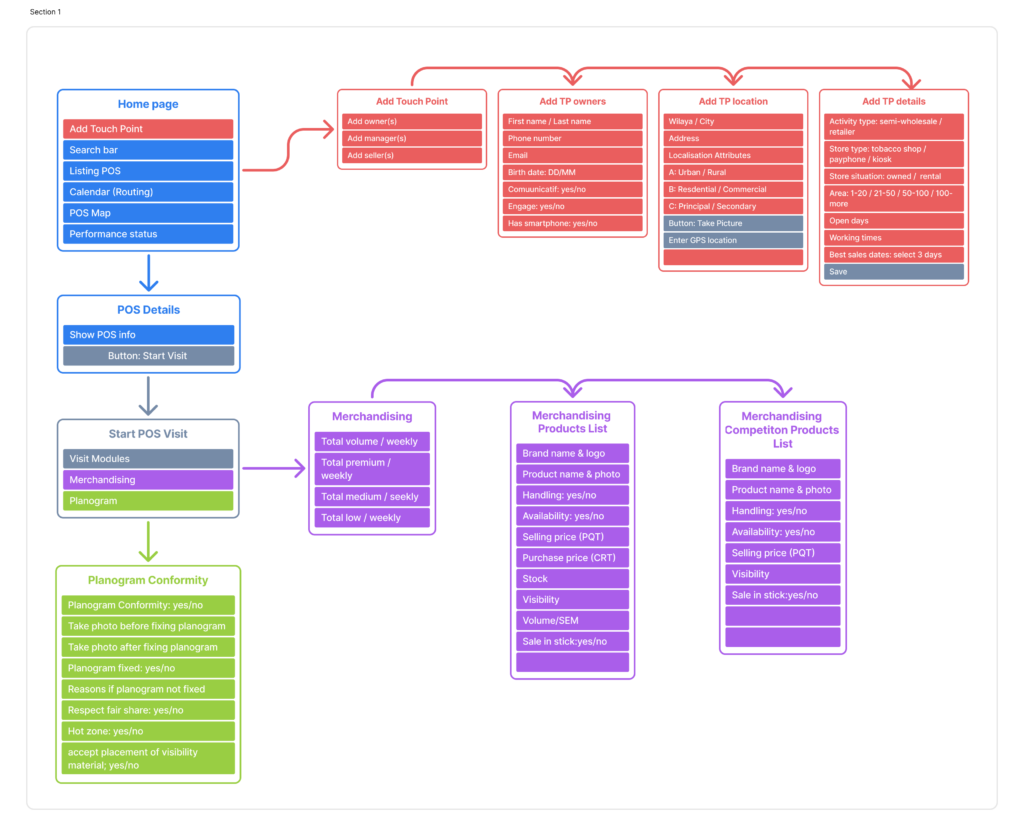
Information Architecture
After field research revealed cognitive overload from complex paper forms, I redesigned the information architecture into a streamlined, step-by-step structure that reduced completion time from 20 to 5 minutes while ensuring GPS verification and mandatory compliance checkpoints.
Strategic Design Solutions
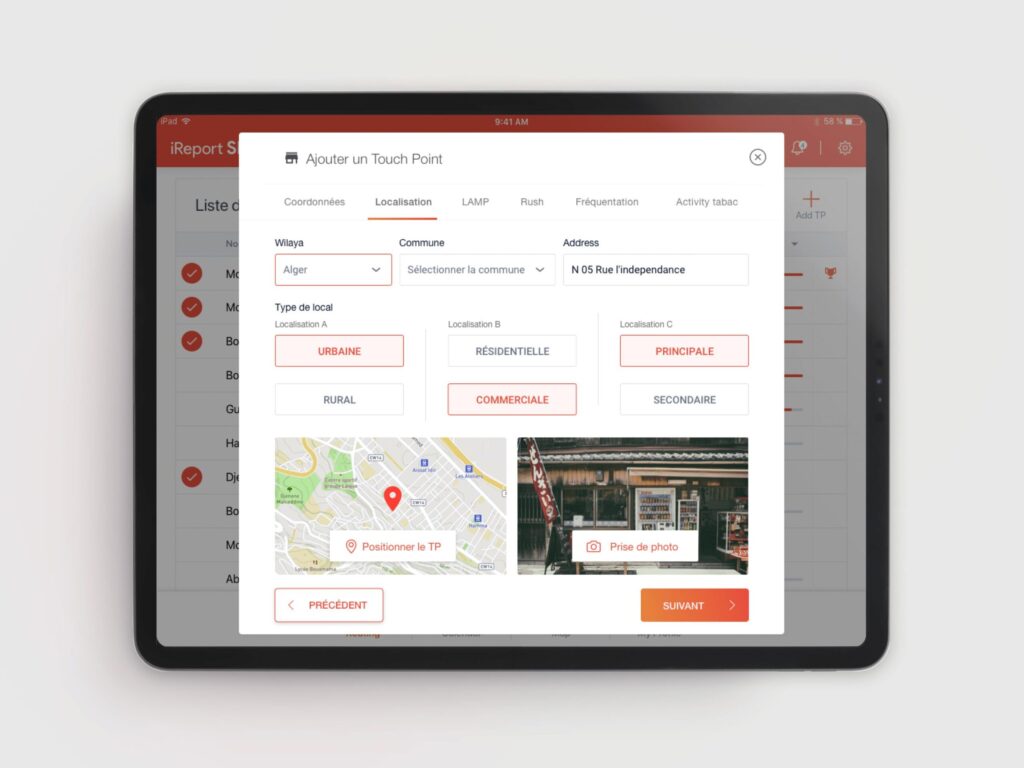
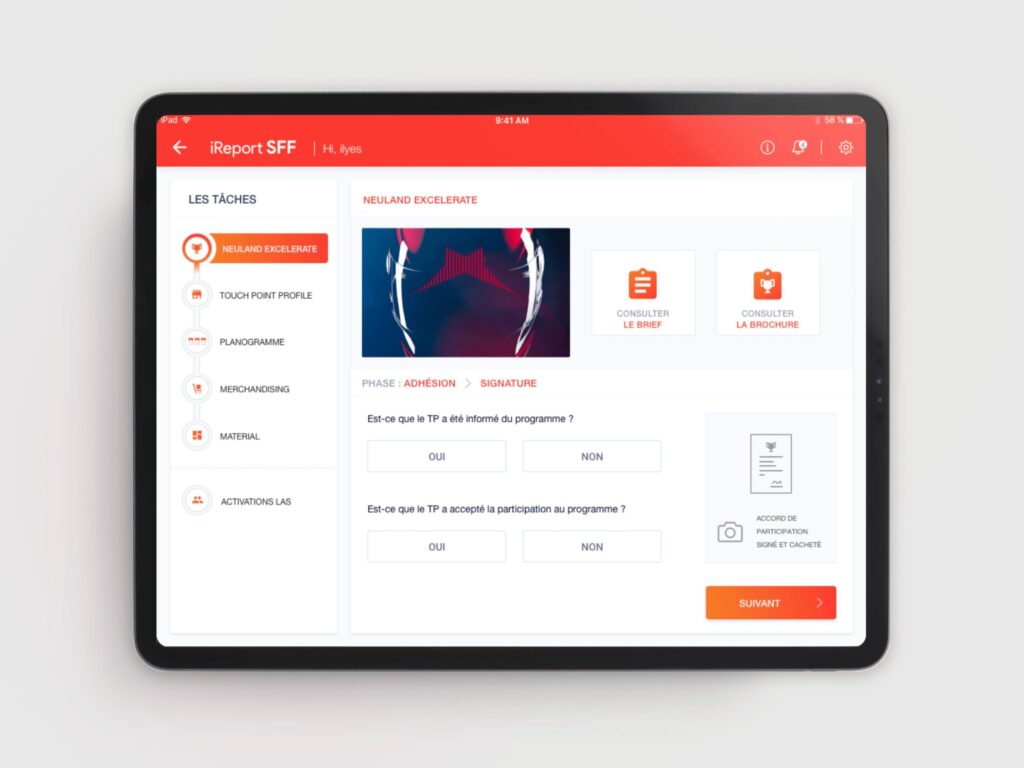
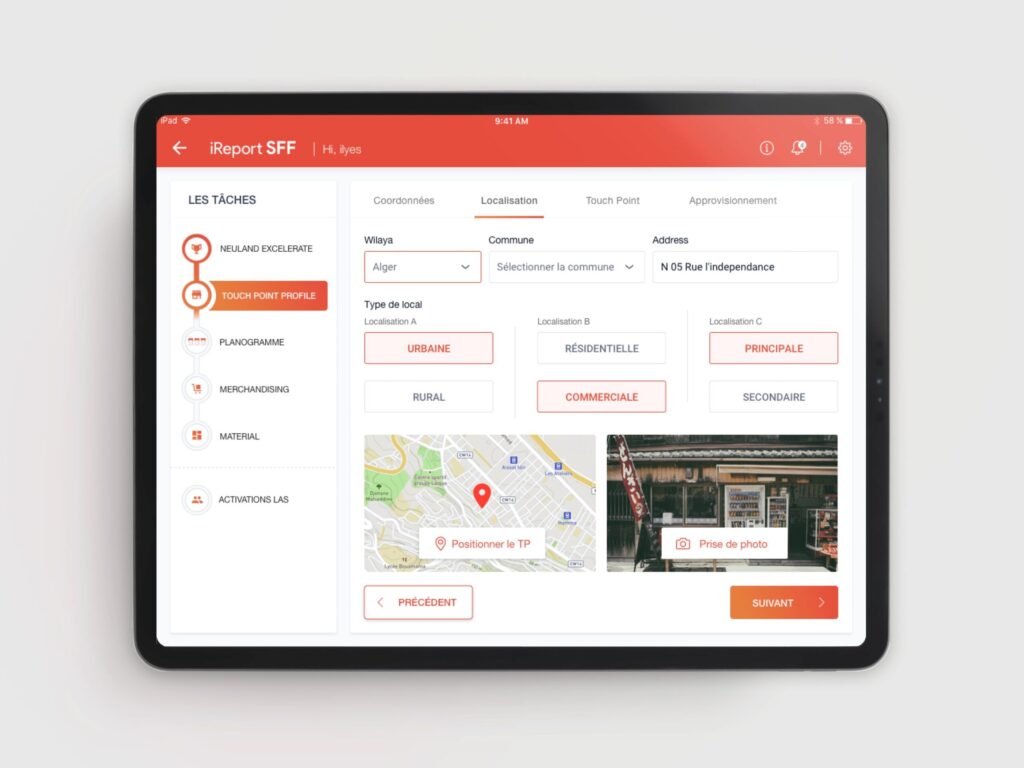
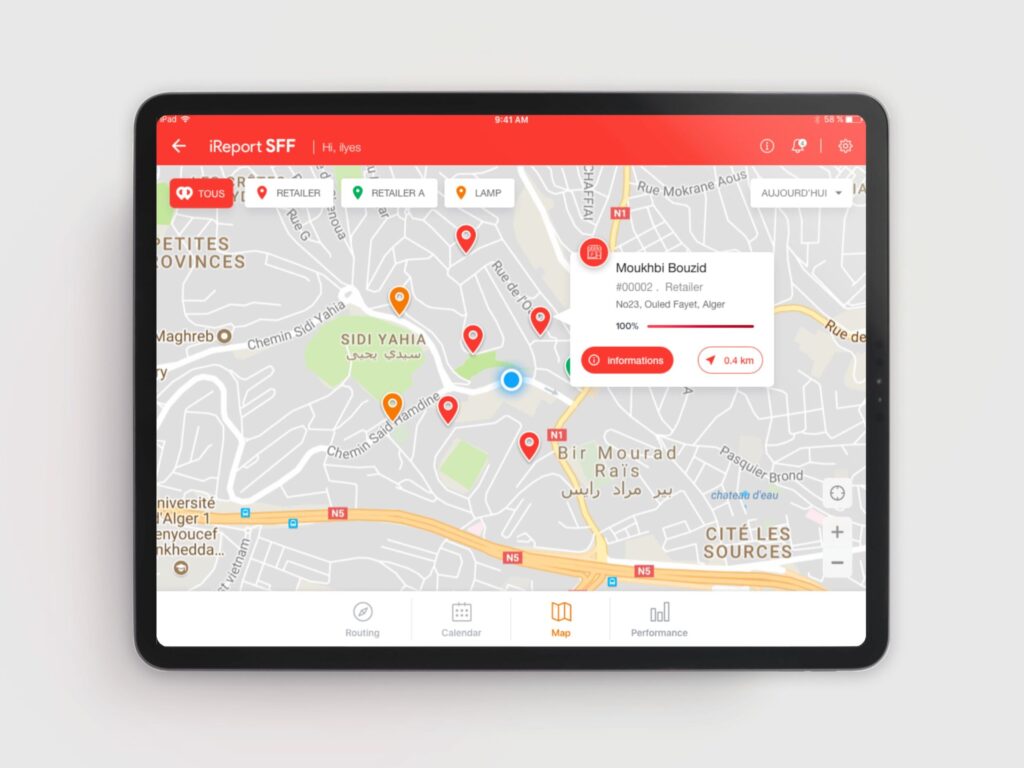
GPS-Locked Accountability System Forms unlock only within 50 meters of sales points via real-time GPS verification, creating built-in accountability that felt fair rather than punitive.
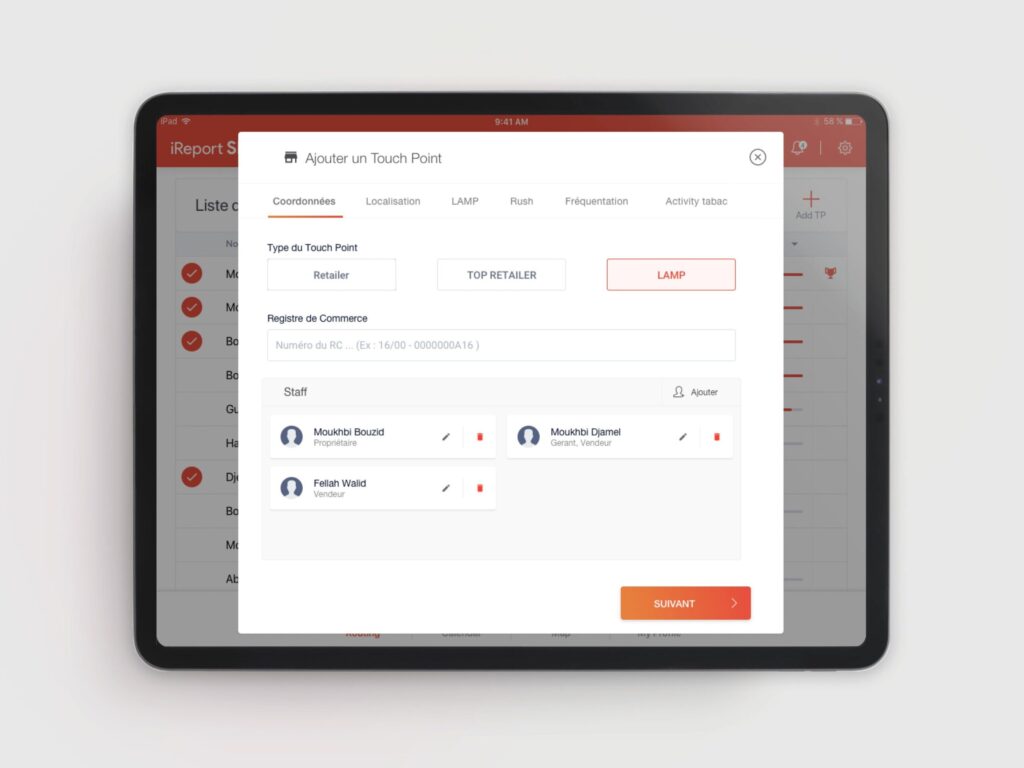
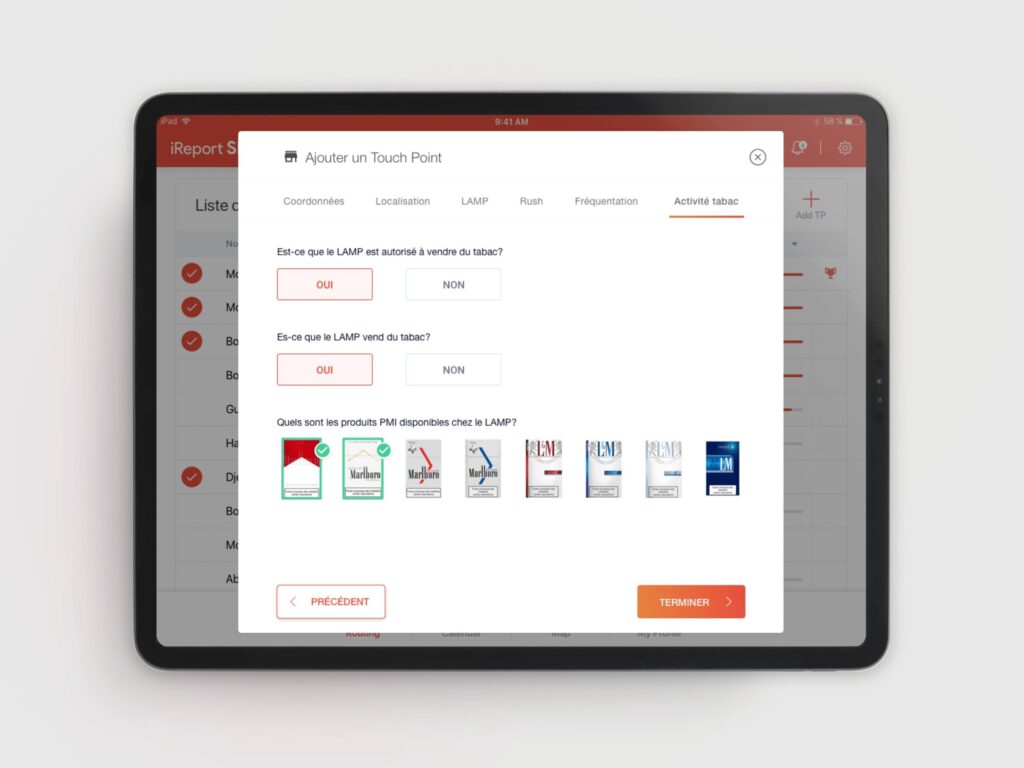
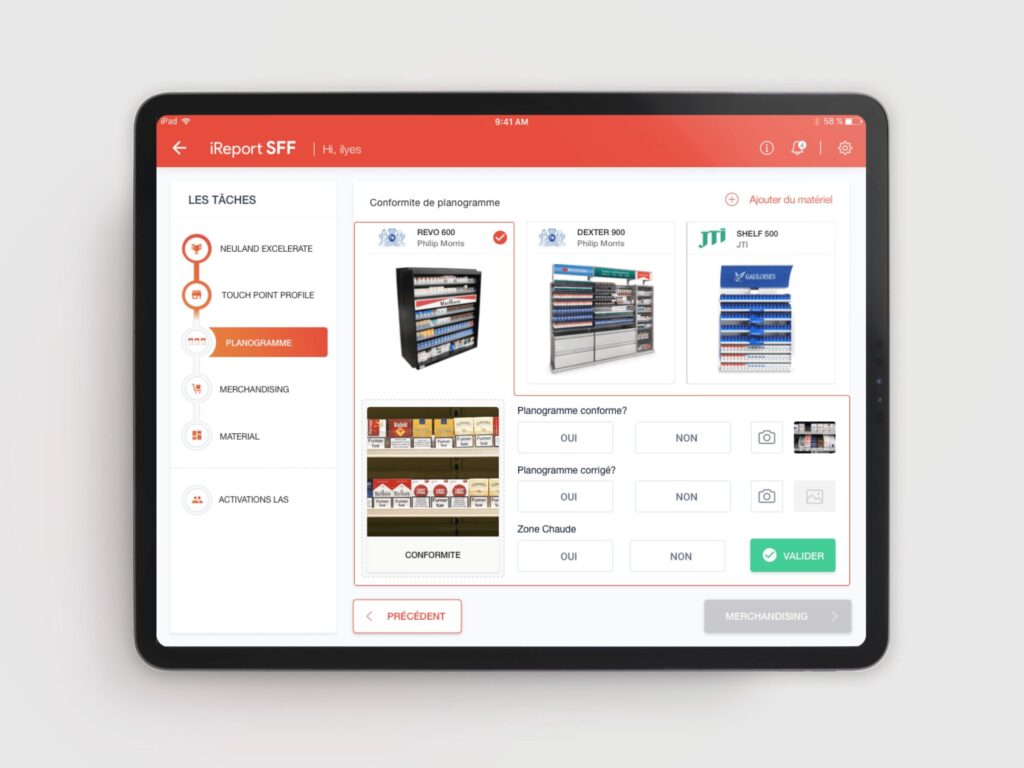
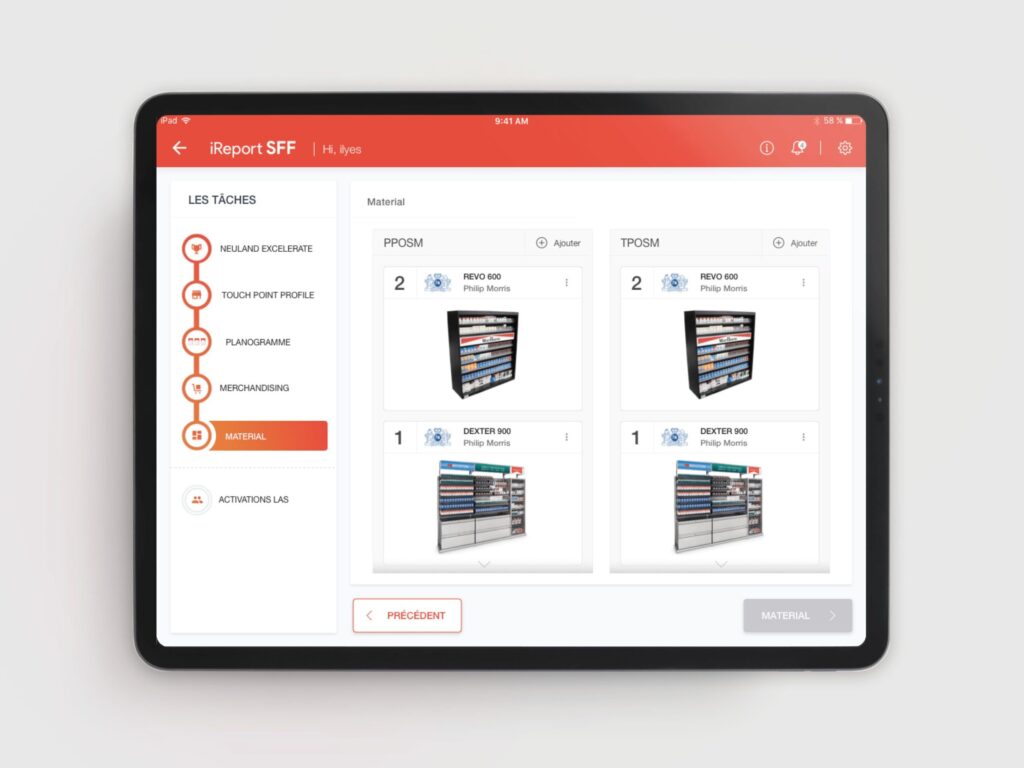
Streamlined Task Architecture Redesigned complex paper forms into logical, bite-sized steps: location identification → product availability → photo capture → competitive analysis → submission.
Real-World Usability Optimization
- Large thumb-accessible targets for one-handed operation
- High-contrast visuals for outdoor sunlight conditions
- Minimal UI per screen to reduce cognitive load
- Instant camera access with simplified targeting
Smart Automation Features
- Contextual error messages replacing generic system alerts
- Auto-filled store information based on GPS location
- Pre-populated fields from previous visits to same location
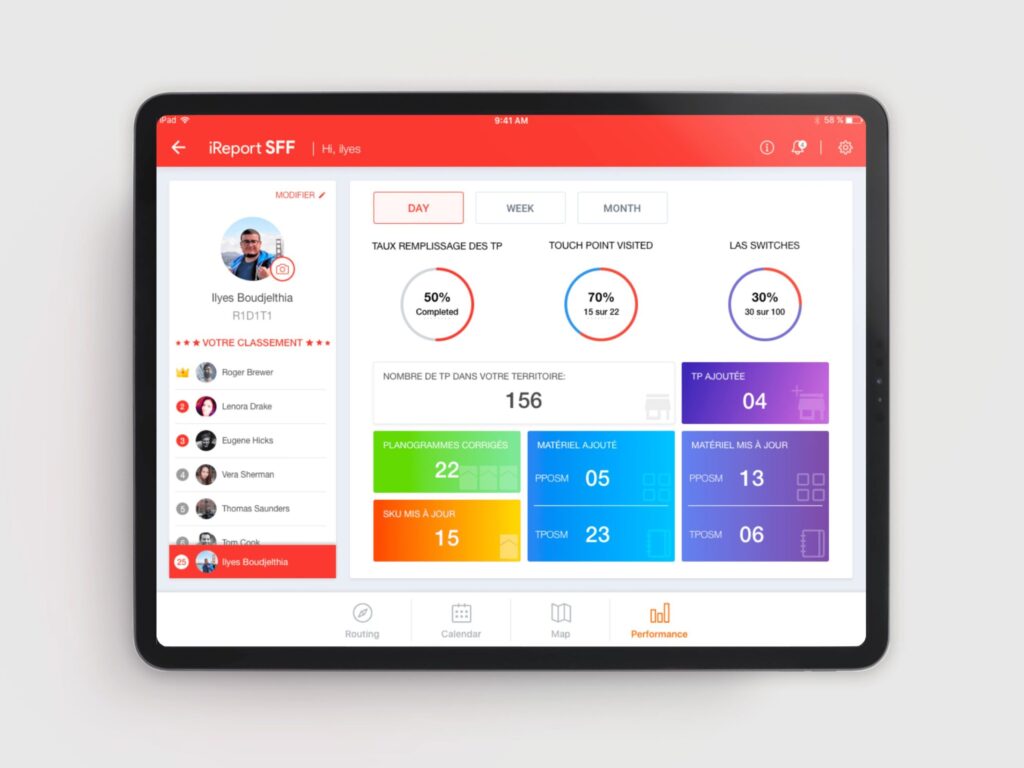
- Clear progress indicators to reduce task abandonment
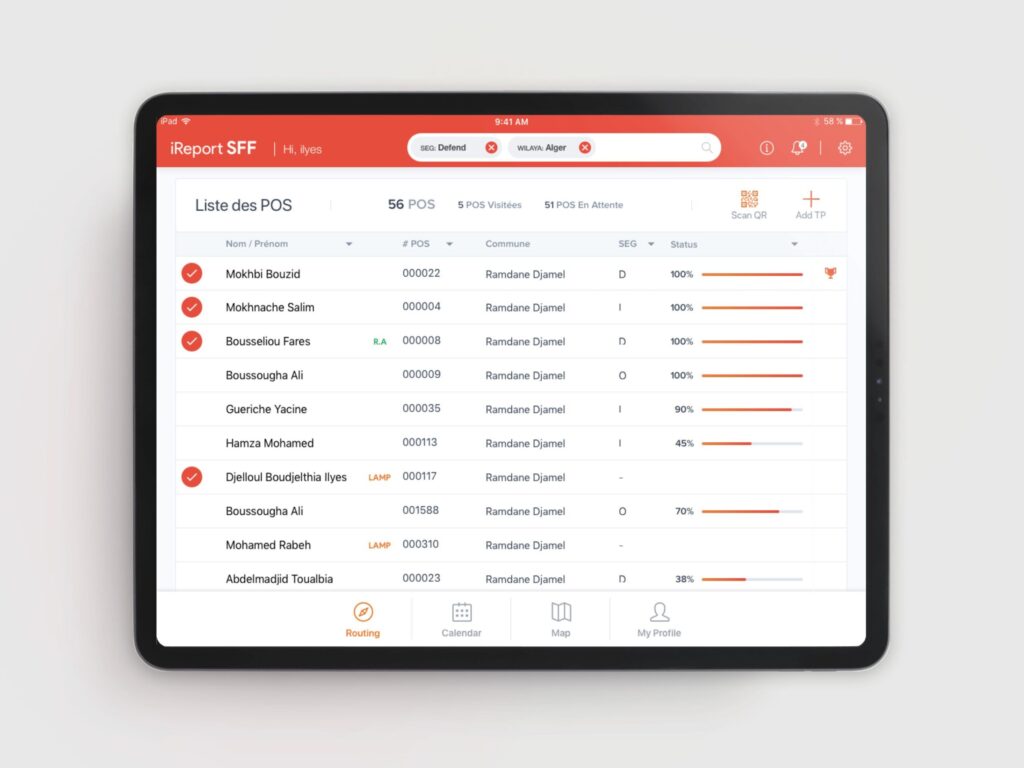
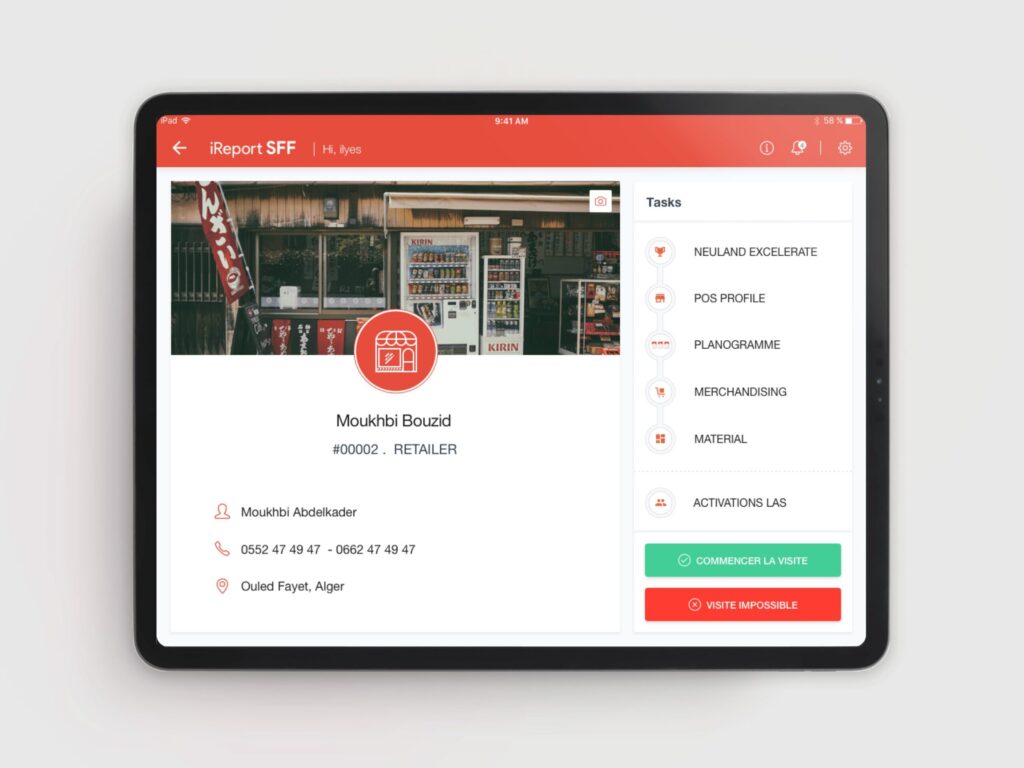
Final Design
Designed for real-world field conditions with high-contrast visuals, large touch targets, and streamlined interfaces optimized for one-handed operation in bright sunlight. The system balanced enterprise compliance requirements with field agent usability needs.

Post-Launch Optimizations
Photo Compliance Issue Agents were skipping mandatory planogram photos. Added submission blocking + inline guidance, achieving 100% photo compliance.
Error Message Redesign Generic error messages caused support calls. Implemented contextual, actionable messages (“Move to sales point entry to begin”), reducing support requests by 50%.
Task Completion Enhancement Users abandoning multi-step process. Added progress indicators and completion summaries, increasing engagement by 30% within 3 months.
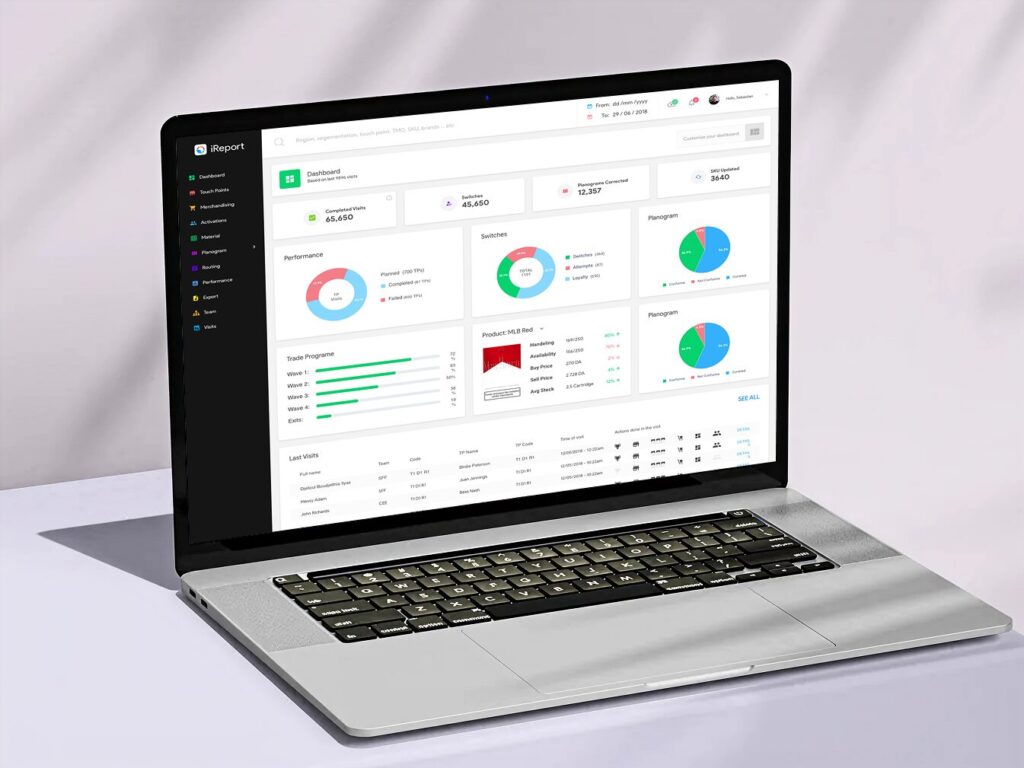
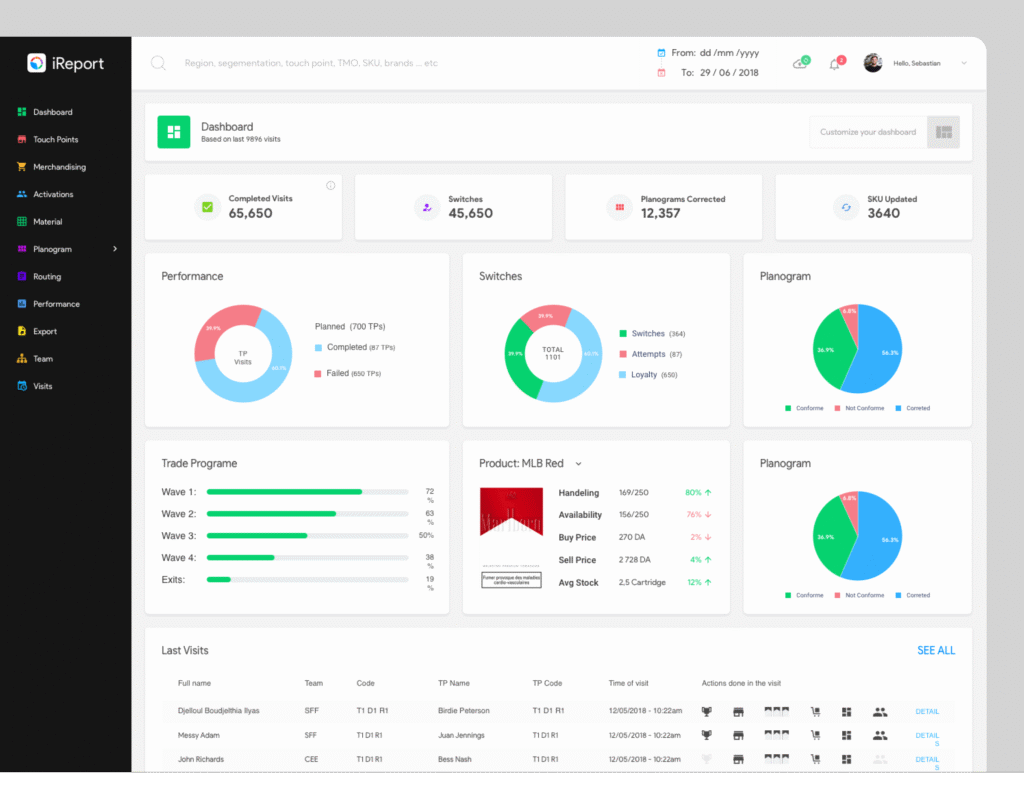
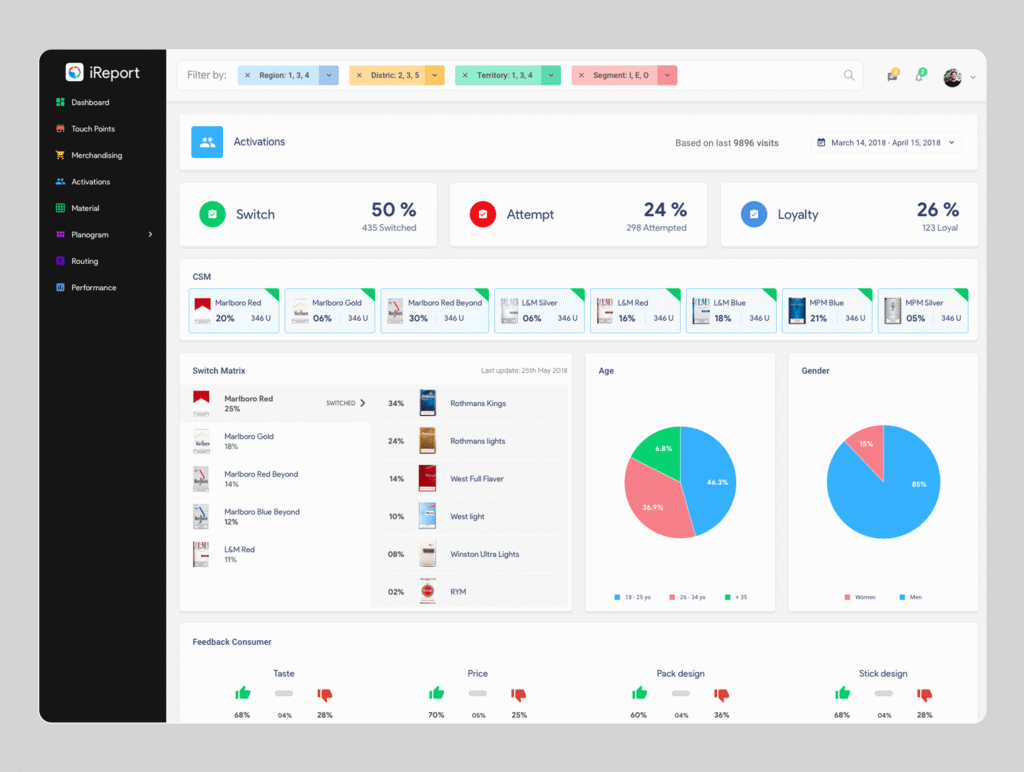
Management Dashboard Design
Research Process: Conducted stakeholder interviews with Philip Morris Algeria teams and top management to understand dashboard requirements and decision-making workflows.
Key Management Needs Identified
- Real-time field presence verification to rebuild trust in data accuracy
- Geographic performance insights across Algeria’s sales territories
- Compliance monitoring for tobacco marketing regulations
- Actionable data replacing weeks-long paper reporting delays
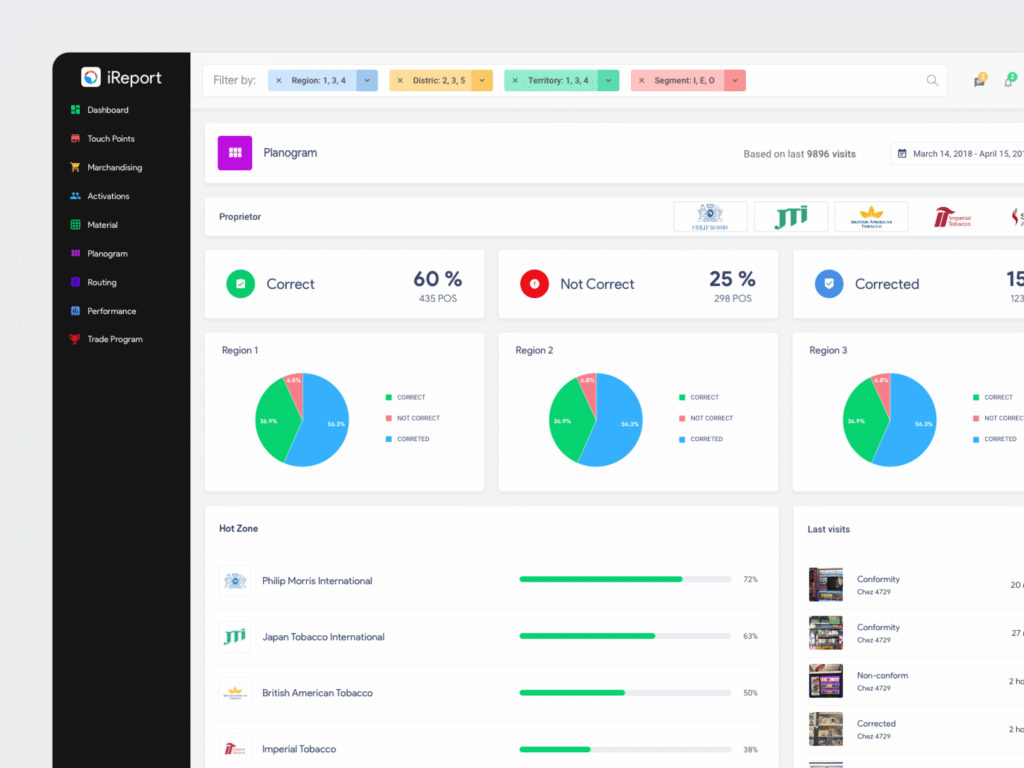
Design Solutions
- Clean, data-focused interface prioritizing immediate insights over complex analytics
- Geographic visualization showing verified field visits and coverage gaps
- Compliance tracking with photo verification and regulatory requirements
- Executive summary views for different management levels
Impact: Transformed management decision-making from weeks-long paper delays to real-time verified insights, enabling 70% faster strategic responses and complete visibility into field operations.
Key Learnings
Context-Driven Design: Single field visit revealed more actionable insights than any assumption-based research could provide.
Trust as Design Problem: GPS verification wasn’t just a technical feature – it was behavioral design intervention that rebuilt organizational trust between agents and management.
Ecosystem Thinking: Improved field agent experience directly enhanced management insights, creating positive feedback loop across entire operational system.
Project Reflections
Management Research Gap: Limited stakeholder interviews constrained dashboard design decisions. Additional management user research would have strengthened the executive interface and improved adoption.
Feedback Integration: The app lacked built-in user feedback mechanisms for continuous improvement. Real-time feedback collection would have accelerated post-launch optimizations and user satisfaction.
Design System Development: Without a component library, future iterations required rebuilding interface elements. A systematic design framework would have improved development efficiency and consistency.
Realizing that rebuilding trust between agents and management was more important than just making a prettier form. That insight shaped every design decision that followed.